
Logs
The Logs tab is your primary debugging tool. Search, filter, and stream MCP events in real-time with a structured query language designed for MCP.
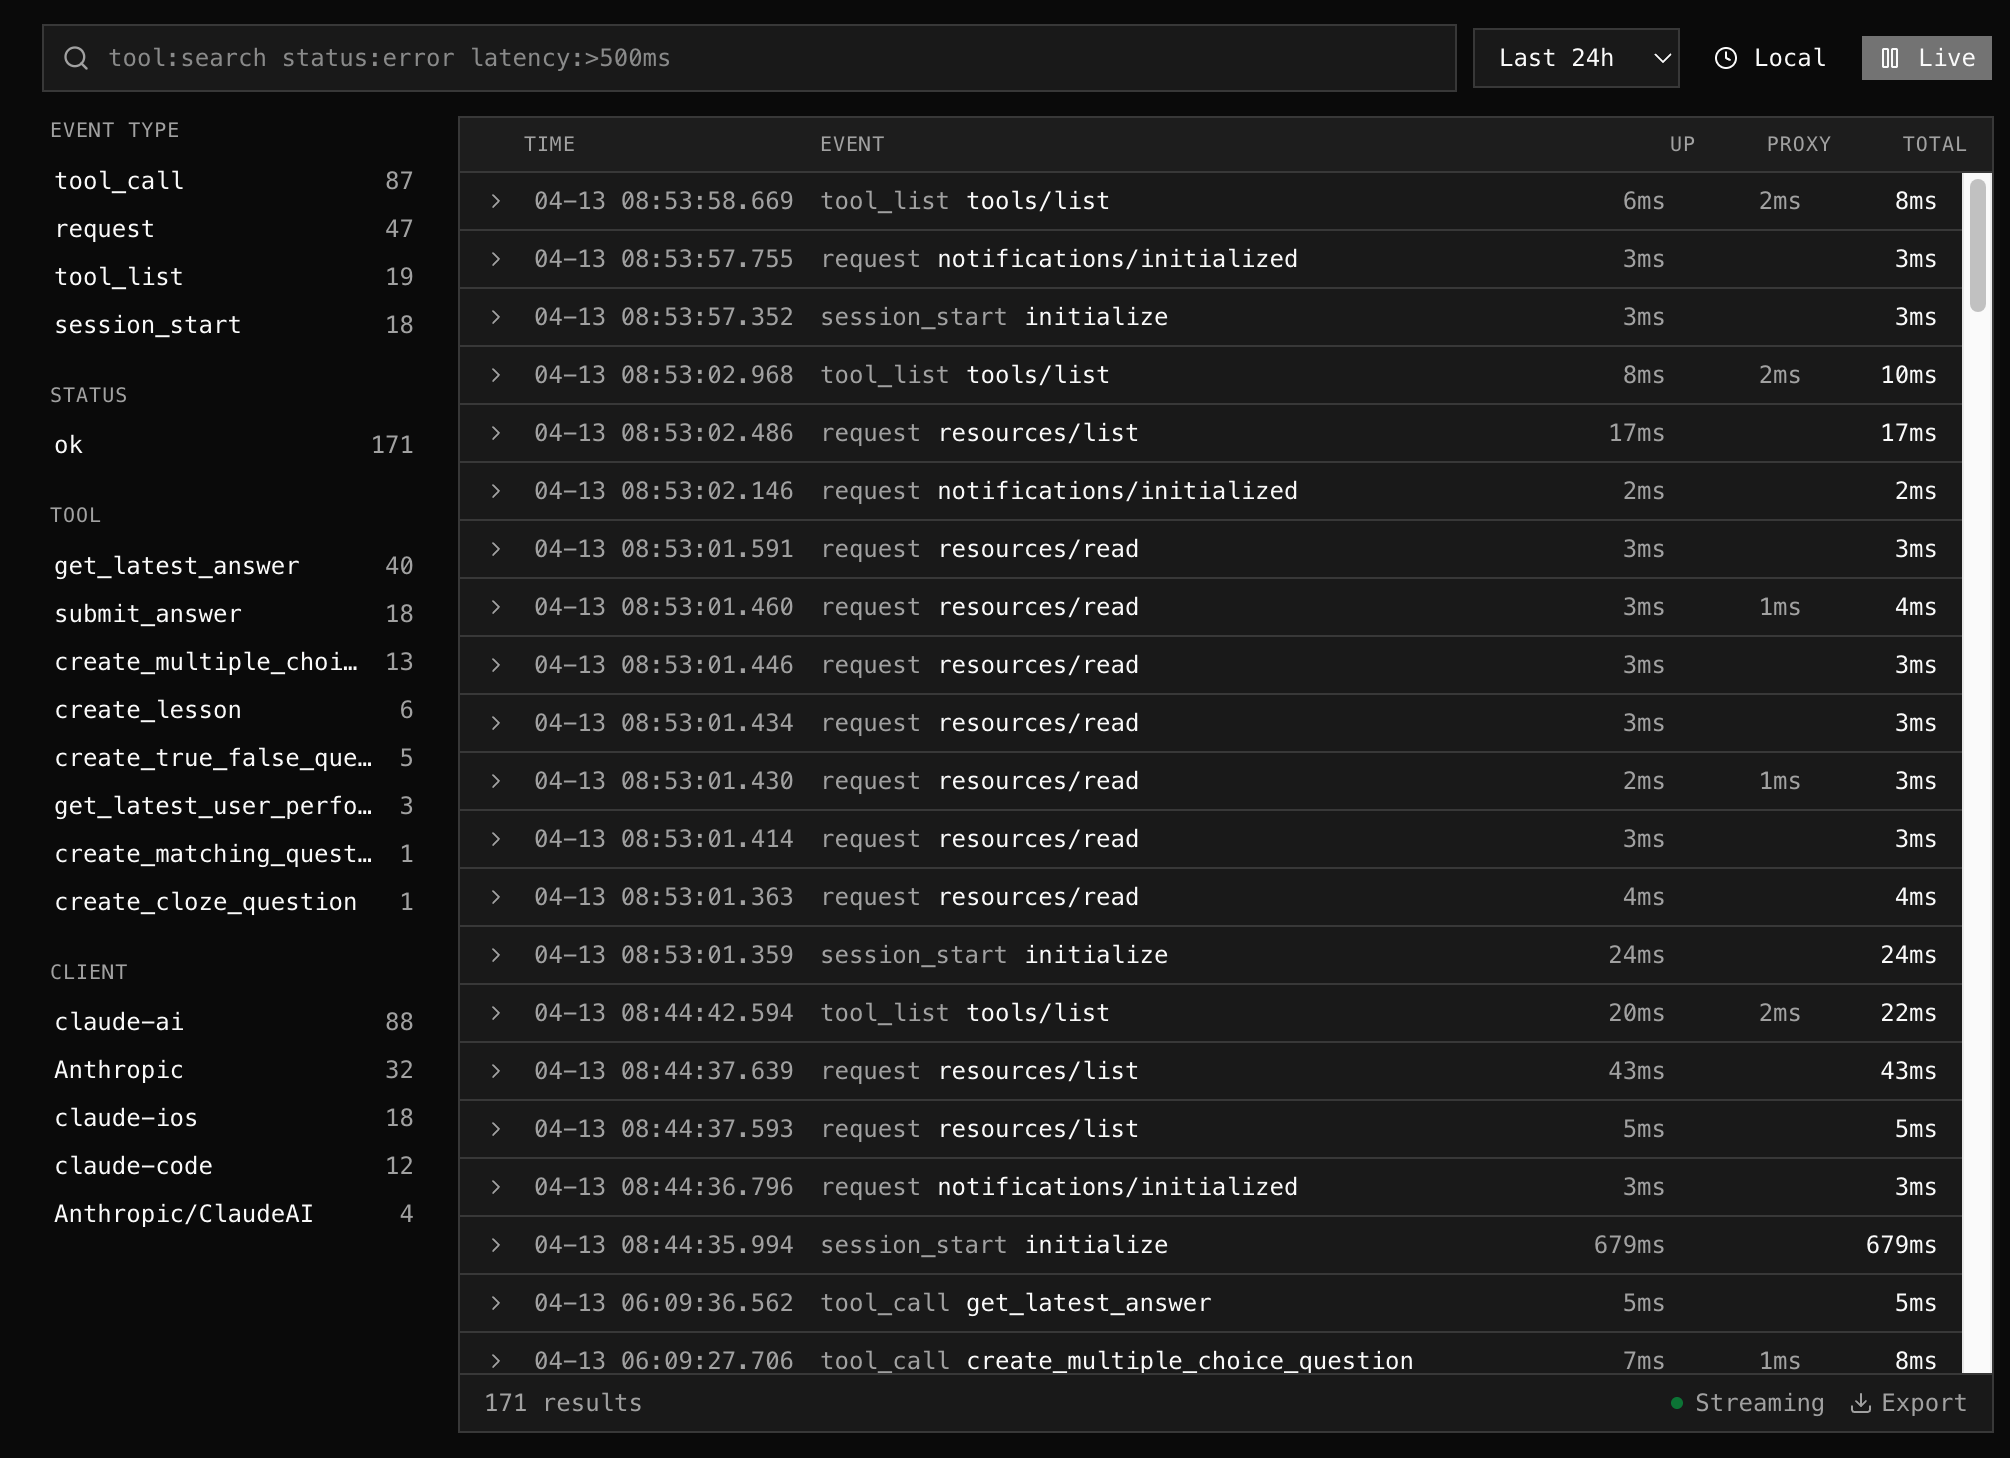
Query Language
Section titled “Query Language”Type structured queries in the search bar to filter events:
tool:search_products status:error latency:>500msSyntax
Section titled “Syntax”| Pattern | Meaning | Example |
|---|---|---|
key:value | Exact match | tool:get_weather |
key:>N | Greater than (numeric) | latency:>500ms |
key:<N | Less than (numeric) | size:<1024 |
key:>=N / key:<=N | Greater/less or equal | latency:>=100 |
key:-value | NOT equal | status:-error |
key:*partial* | Wildcard match | tool:*search* |
bare words | Free text search | timeout connection |
Available Facets
Section titled “Available Facets”| Facet | Filters on | Example |
|---|---|---|
tool | Tool name | tool:create_order |
status | ok, error, denied | status:error |
method | MCP method | method:tools/call |
client | Client name | client:claude-ai |
session | Session ID | session:4a4e7179-b27b... |
type | Event type | type:tool_call |
error | Error message text | error:*timeout* |
latency | Total latency (ms) | latency:>500 |
upstream | Upstream time (ms) | upstream:>200 |
size | Response size (bytes) | size:>10240 |
proxy | Proxy name | proxy:production |
note | Classification | note:rewritten |
Units are optional: latency:>500ms, size:>1KB, size:>1MB all work.
The query bar highlights syntax as you type — keys in blue, values in green.
Facet Sidebar
Section titled “Facet Sidebar”The left panel shows the top values for each facet, scoped to your current query and time range:
- Event Type — tool_call (142), session_start (20), request (8)…
- Status — ok (250), error (14)
- Tool — search_products (80), get_product (40)…
- Client — claude-ai (162), claude-code (12)…
Click any value to add it to the query bar. If that facet is already in the query, it replaces the value.
Live Streaming
Section titled “Live Streaming”Toggle Live to stream events in real-time (polls every 2 seconds). The log list auto-scrolls to show new events. Pause to freeze the view for inspection.
Time Range
Section titled “Time Range”Select from presets (1h, 6h, 24h, 7d, 30d) or pick a custom date/time range.
Timezone
Section titled “Timezone”Toggle between Local (browser timezone) and UTC. The current mode is shown next to the time range selector.
Log Detail
Section titled “Log Detail”Click any log row to expand it and see:
- Error detail (if any)
- Client name + version
- Session ID (click to search for all events in that session)
- Upstream address
- Request/response sizes
- Metadata (JSON)
Shareable URLs
Section titled “Shareable URLs”The query, time range, and timezone are stored in the URL. Copy the URL to share a specific log view with a teammate:
/dashboard/servers/abc123?q=tool:search+status:error&range=7d&tz=utcExport
Section titled “Export”Click Export in the footer to download the current log results as a JSON file.