
Server Overview
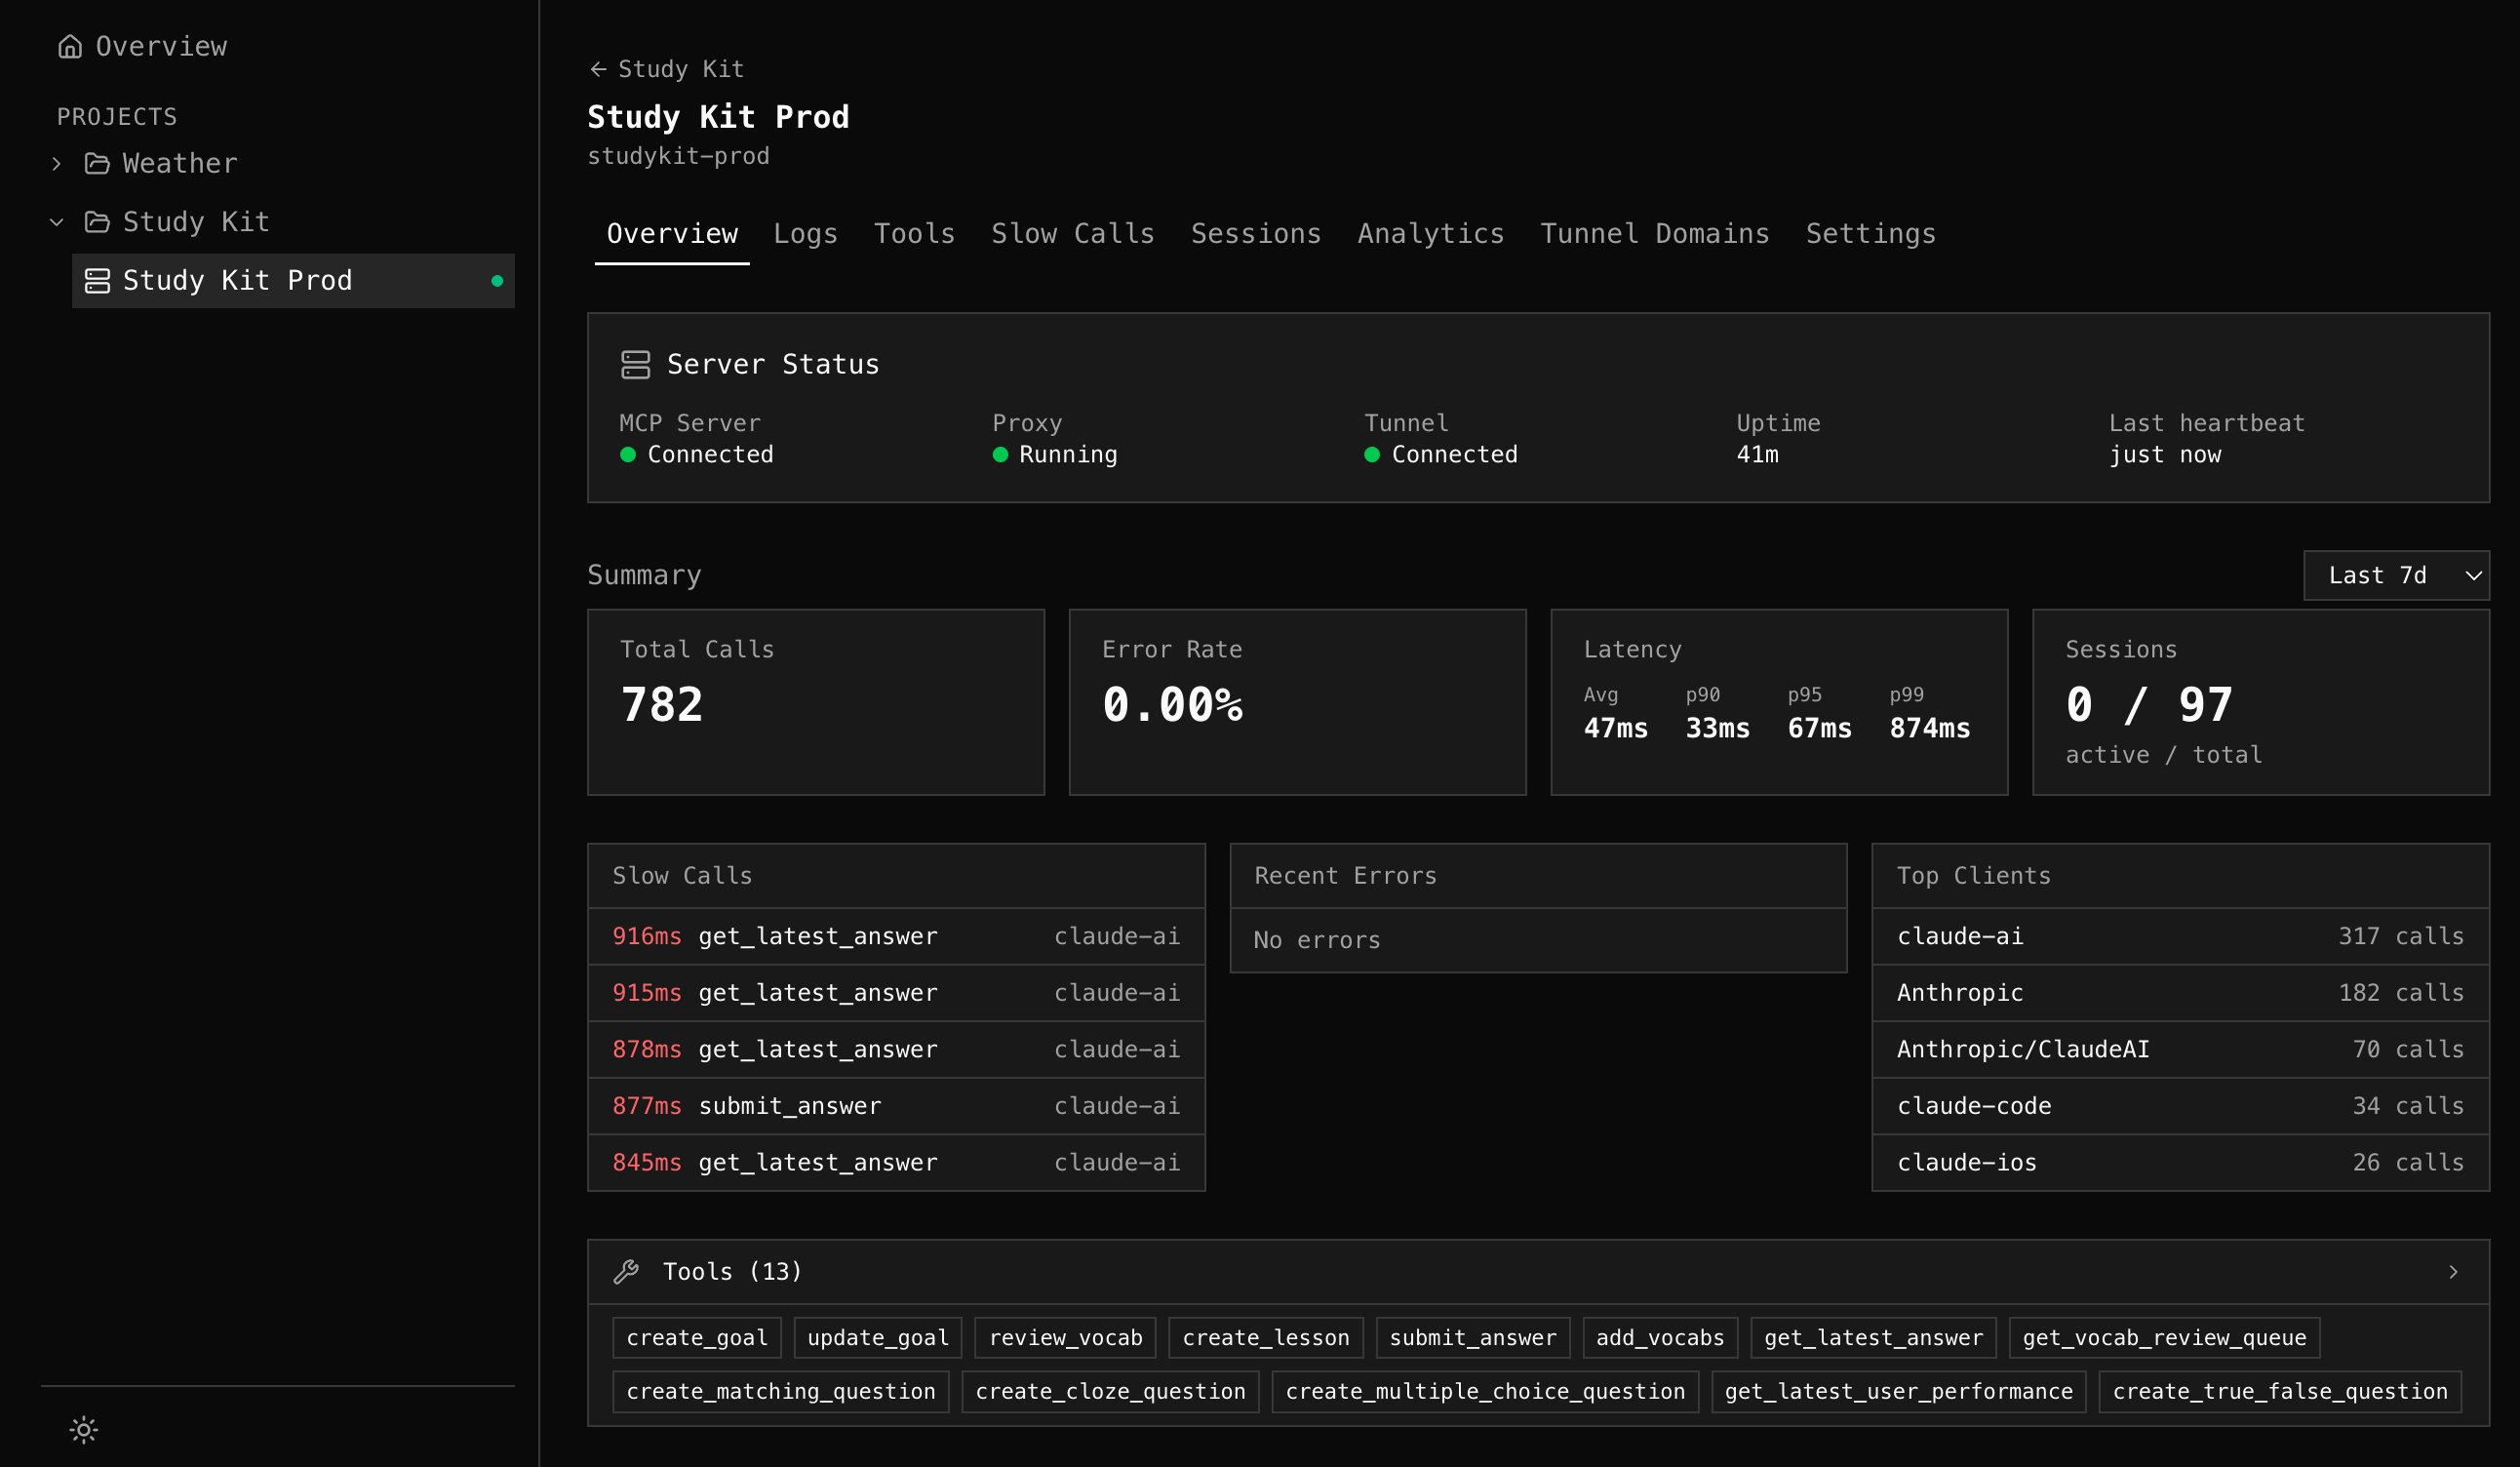
The Overview tab is your server’s home page. It answers “is everything OK?” in seconds.
Server Status
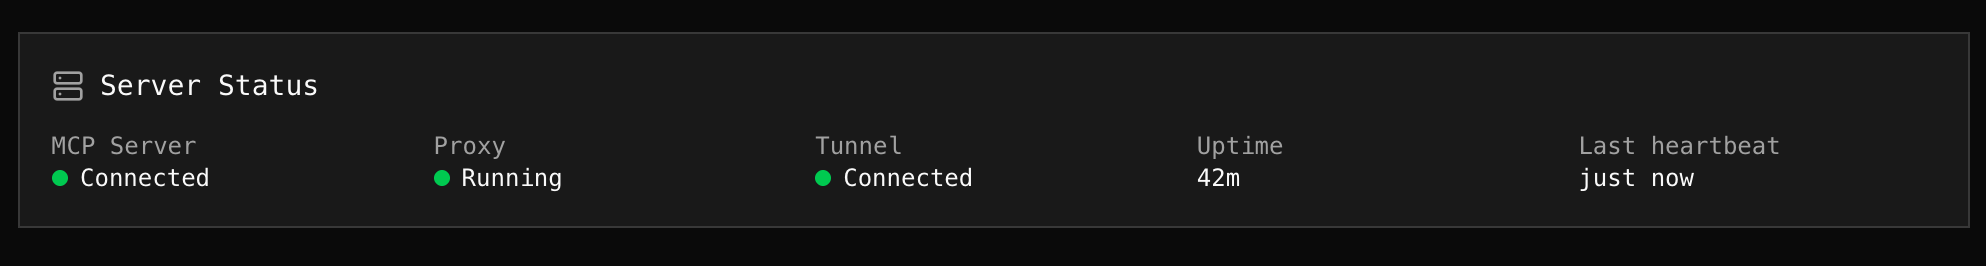
Section titled “Server Status”The status card shows real-time health of your MCP infrastructure:
| Field | What it shows |
|---|---|
| MCP Server | Connection to upstream MCP server (Connected / Disconnected) |
| Proxy | Whether the mcpr process is running and sending heartbeats |
| Tunnel | Tunnel connection status |
| Uptime | How long the proxy has been running |
| Last heartbeat | When the proxy last reported in |
Server info from the MCP initialize handshake is shown below: server name, version, protocol version, and declared capabilities (tools, resources, prompts).
Summary Cards
Section titled “Summary Cards”Four metrics for the selected time range:
| Card | What it shows |
|---|---|
| Total Calls | MCP request count |
| Error Rate | Percentage of failed requests |
| Latency | Avg, p90, p95, p99 percentiles for tool calls |
| Sessions | Active (last 5 min) / total unique sessions |
Use the time range dropdown (1h / 6h / 24h / 7d / 30d) to adjust the window.
Quick Insights
Section titled “Quick Insights”Three panels below the summary cards highlight what needs attention:
Slow Calls
Section titled “Slow Calls”The 5 slowest tool calls in the time range. Each shows latency, tool name, and client. Click to jump to the Logs tab with a pre-filled query for that specific session + tool.
Recent Errors
Section titled “Recent Errors”The 5 most frequent error groups (tool + error message). Click to search for that tool’s errors in Logs.
Top Clients
Section titled “Top Clients”The 5 most active AI clients by call count.
MCP Schema
Section titled “MCP Schema”A compact summary of your server’s discovered schema — how many tools, resources, and prompts are exposed, the current schema version, and a list of tool names as tags. Used tools show in normal text; unused tools are dimmed.
Click the schema header to navigate to the Tools tab for full detail.
The schema is captured passively from MCP discovery responses (initialize, tools/list, etc.) flowing through the proxy. No active polling, no extra auth needed.