
Slow Calls
The Slow Calls tab ranks individual tool invocations by latency — heaviest first. Use it to find specific outliers and understand why they were slow.
What you see
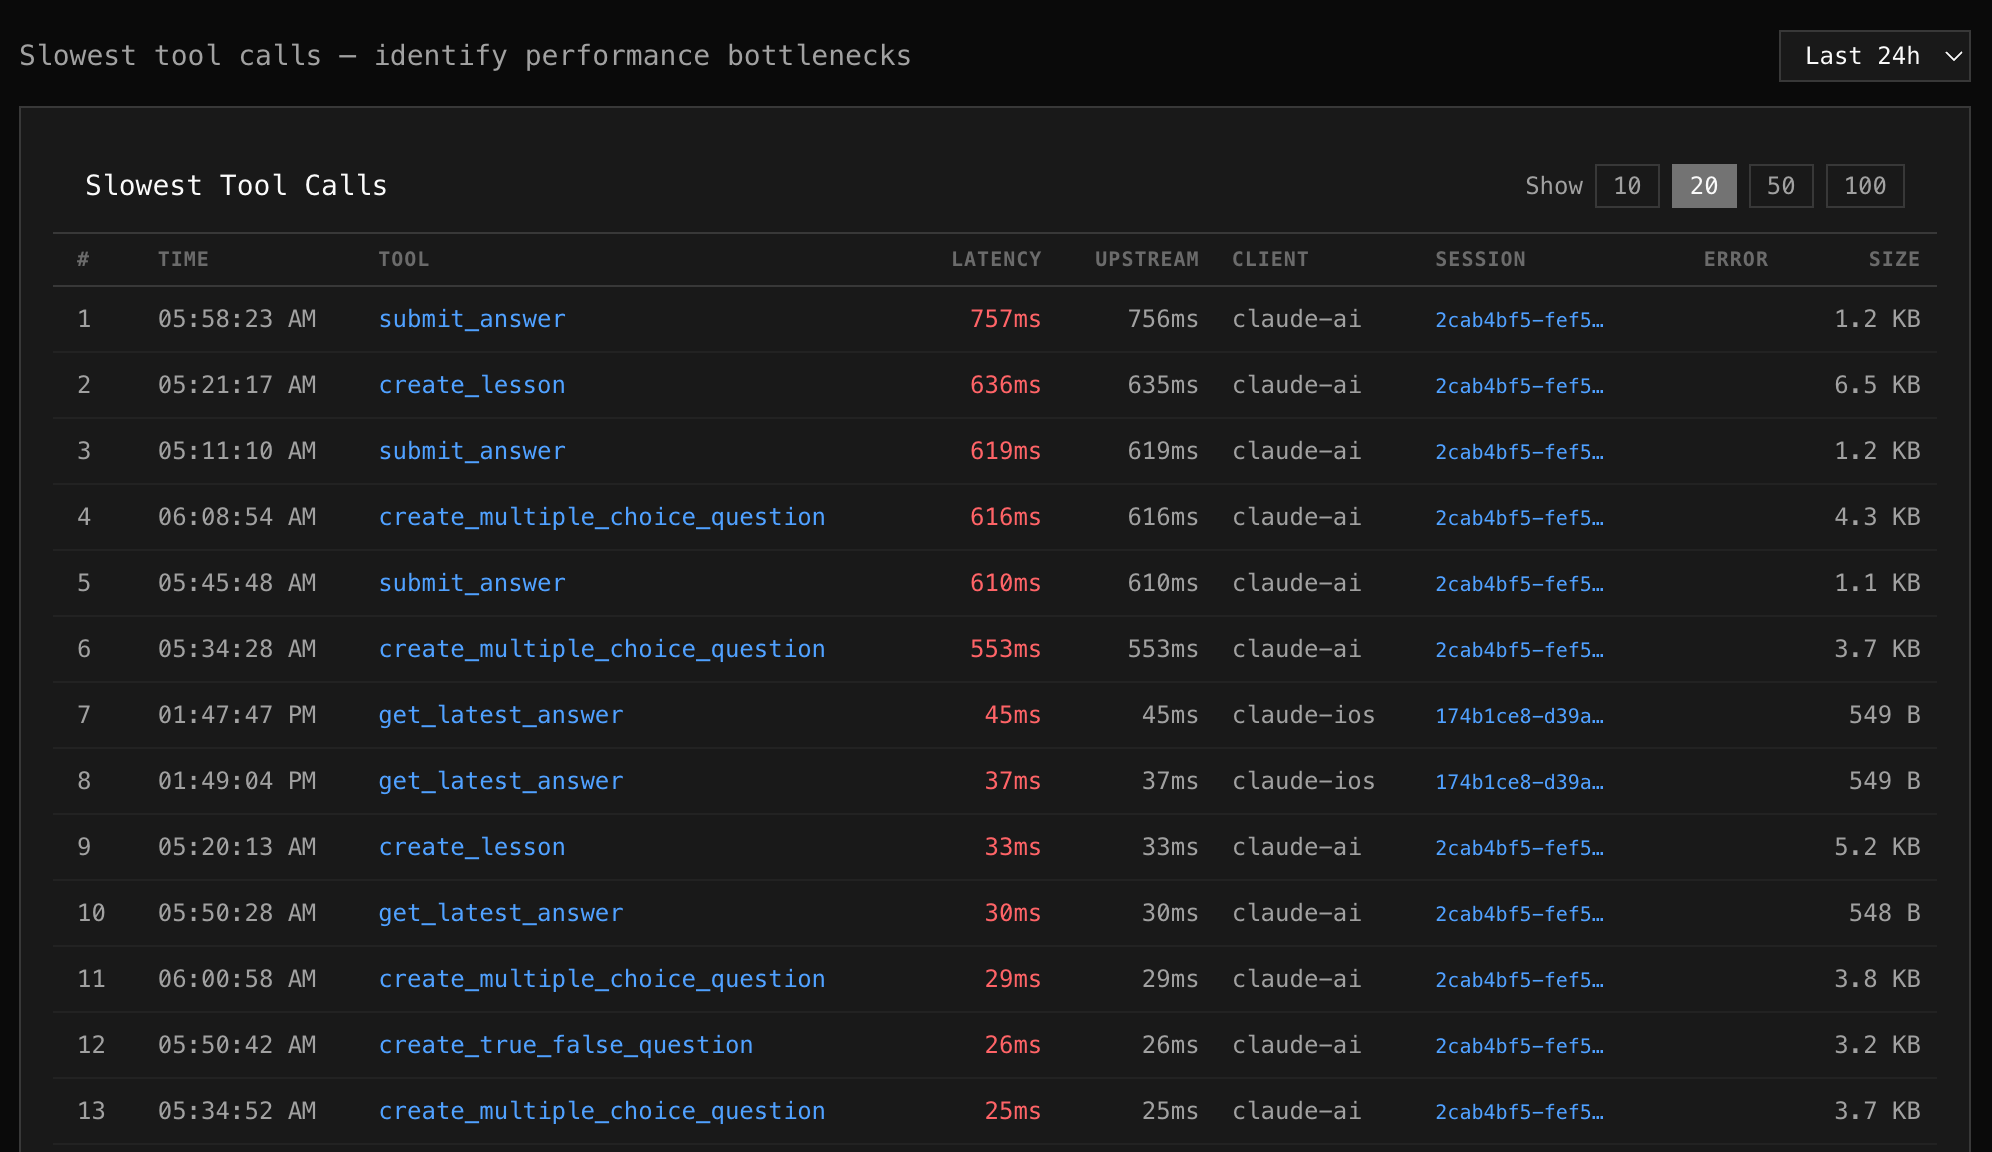
Section titled “What you see”Each row is a single tool call, showing:
| Column | Description |
|---|---|
| # | Rank by latency |
| Time | When the call happened (date + time) |
| Tool | Which tool was called |
| Latency | Total end-to-end time (highlighted in red) |
| Upstream | Time spent waiting for your MCP server |
| Client | Which AI client made the call |
| Session | Session ID (click to copy) |
| Error | Error message if the call failed |
| Size | Response payload size |
Reading the data
Section titled “Reading the data”Upstream vs Proxy overhead
Section titled “Upstream vs Proxy overhead”If Upstream is close to Latency, the bottleneck is your MCP server. If there’s a large gap, the proxy or network added overhead.
Response size correlation
Section titled “Response size correlation”A slow call with a large response (e.g., 14 KB) might be slow because of data transfer, not processing time. A slow call with a tiny response (549 B) that takes 500ms is likely a server-side bottleneck.
Error correlation
Section titled “Error correlation”Slow calls that also have errors often indicate timeouts or retries. Check the error column for “timeout”, “connection refused”, or retry-related messages.
Controls
Section titled “Controls”- Show — toggle between 10, 20, 50, or 100 results
- Time range — adjust the window (1h to 30d)
Next steps
Section titled “Next steps”Found a slow tool? Go to Logs and search tool:slow_tool_name to see all recent calls, not just the outliers.