
Tools
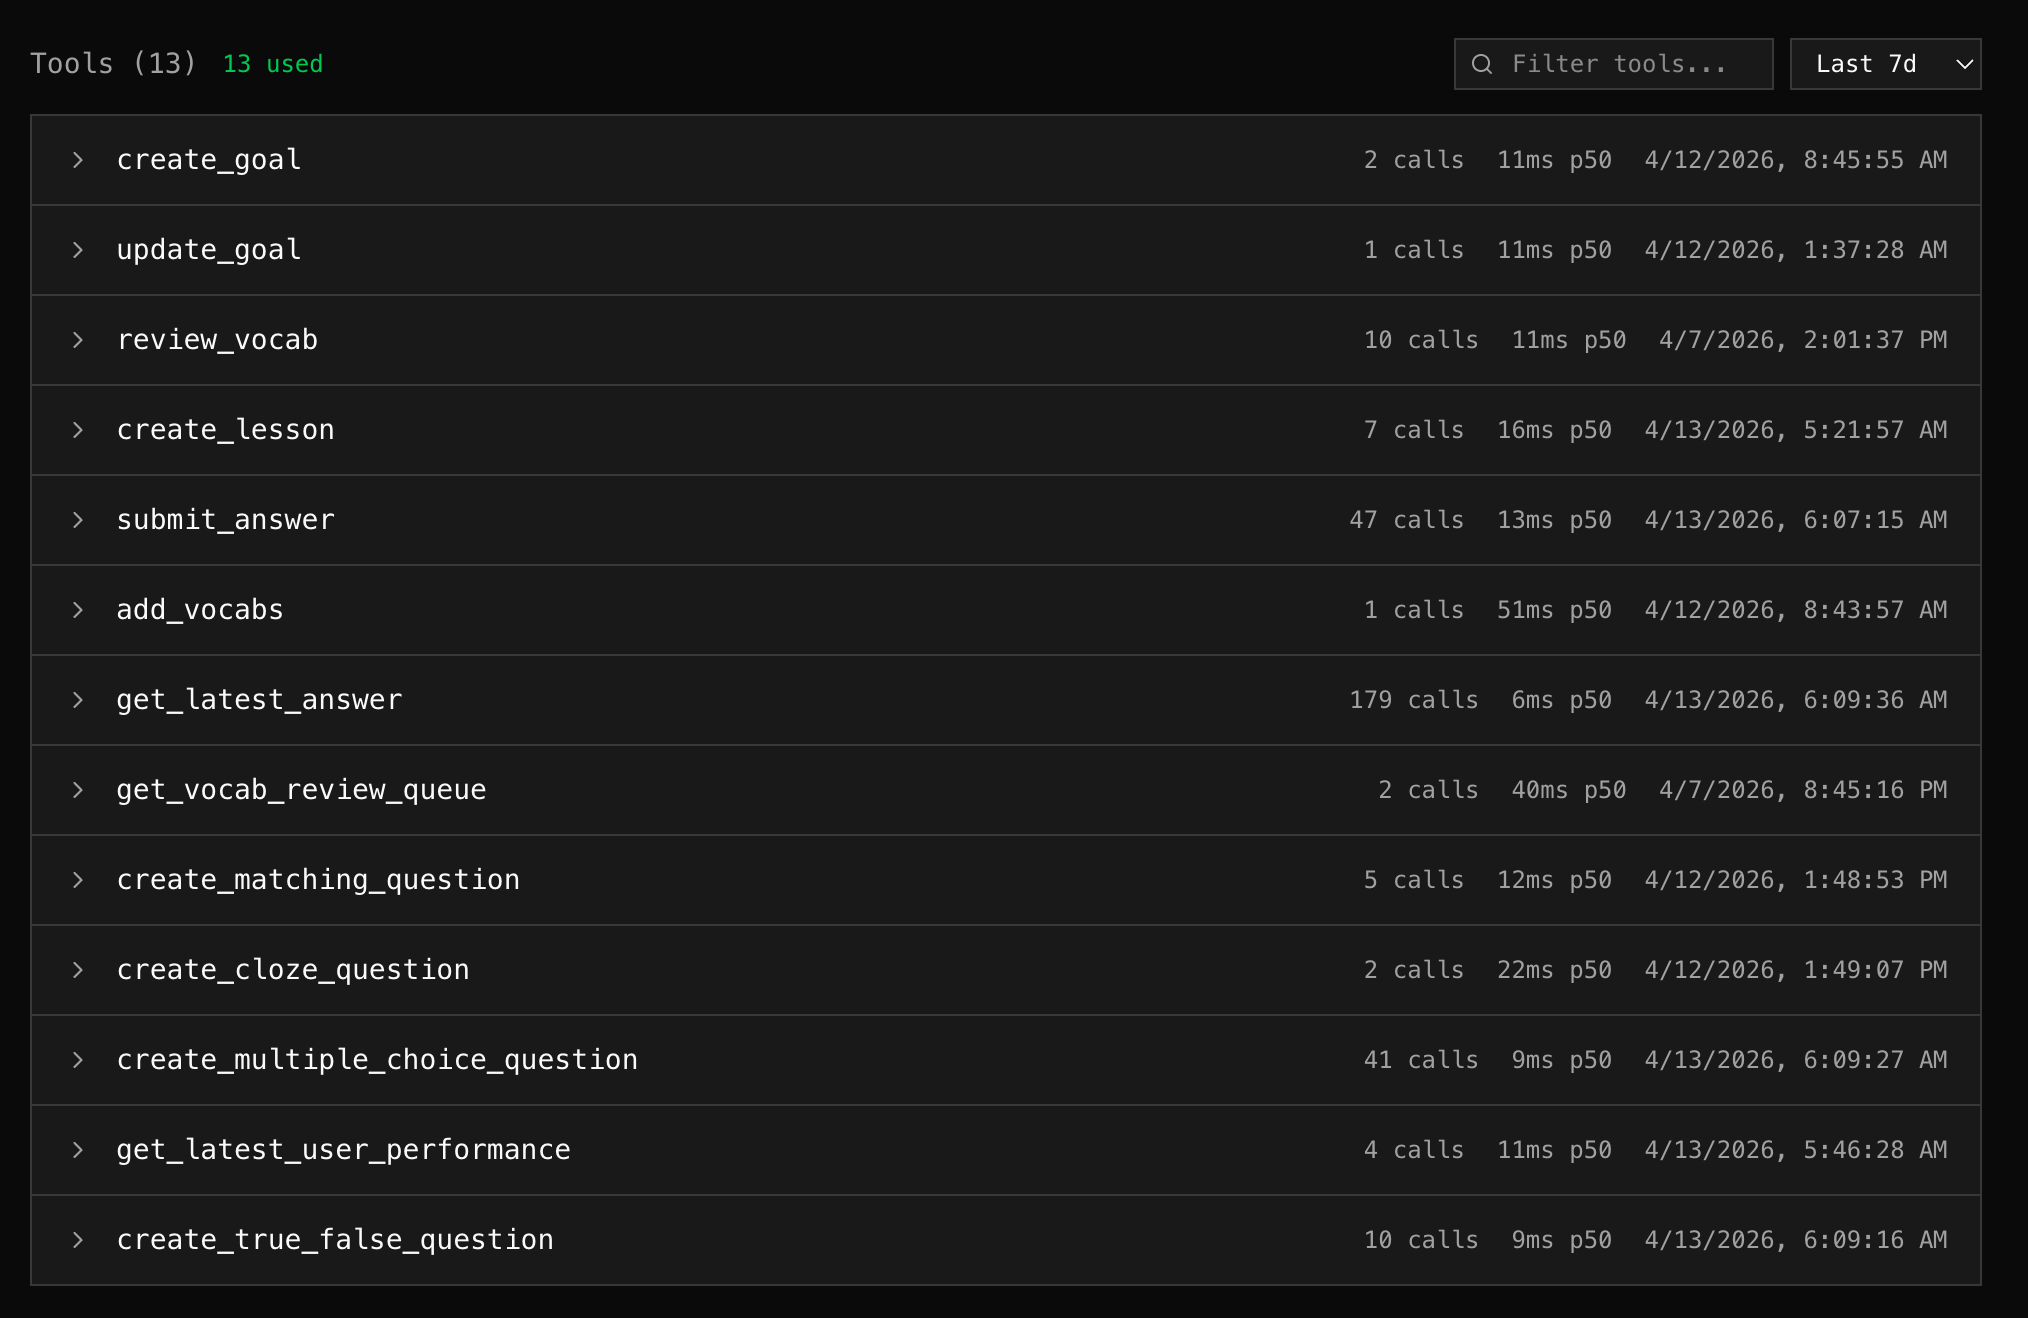
The Tools tab shows every tool your MCP server exposes, cross-referenced with actual usage data.
Tool List
Section titled “Tool List”Each tool shows:
| Field | Description |
|---|---|
| Name | Tool name from MCP tools/list |
| Description | Tool description from schema |
| Calls | Number of invocations in the time range |
| Errors | Error count and rate |
| p50 Latency | Median response time |
| Last Called | When the tool was last invoked |
Used vs Unused
Section titled “Used vs Unused”Tools are classified based on actual call data:
- Used — called at least once in the selected time range
- Unused — listed by the server but never called (dimmed, marked with “unused” badge)
The header shows counts: “5 tools — 3 used, 2 unused”
This helps answer: “Are clients actually using what the server exposes?”
Tool Detail
Section titled “Tool Detail”Click any tool to expand and see:
- Stats cards — calls, errors (with percentage), p50 latency, last called
- Input schema — the full JSON Schema for the tool’s parameters
- View in Logs — link to the Logs tab filtered to this tool
Schema Versions
Section titled “Schema Versions”mcpr Cloud tracks every change to your MCP schema. When the proxy captures a new tools/list response with a different hash, it creates a new version.
The current version is shown as a badge (e.g., v3) in the tool list header.
How schema capture works
Section titled “How schema capture works”- An MCP client connects through the proxy
- The client calls
initialize→ proxy captures server info - The client calls
tools/list→ proxy captures tool definitions - The captured schema is synced to mcpr Cloud
- If the schema changed (different hash), a new version is created
No active polling — schema is captured passively from traffic flowing through the proxy.
Stale detection
Section titled “Stale detection”If the MCP server sends a notifications/tools/list_changed notification, the schema is marked as stale until a client fetches the updated tools/list.
Search & Filter
Section titled “Search & Filter”Use the search box to filter tools by name or description. Use the time range selector to adjust the usage stats window.