
Sessions
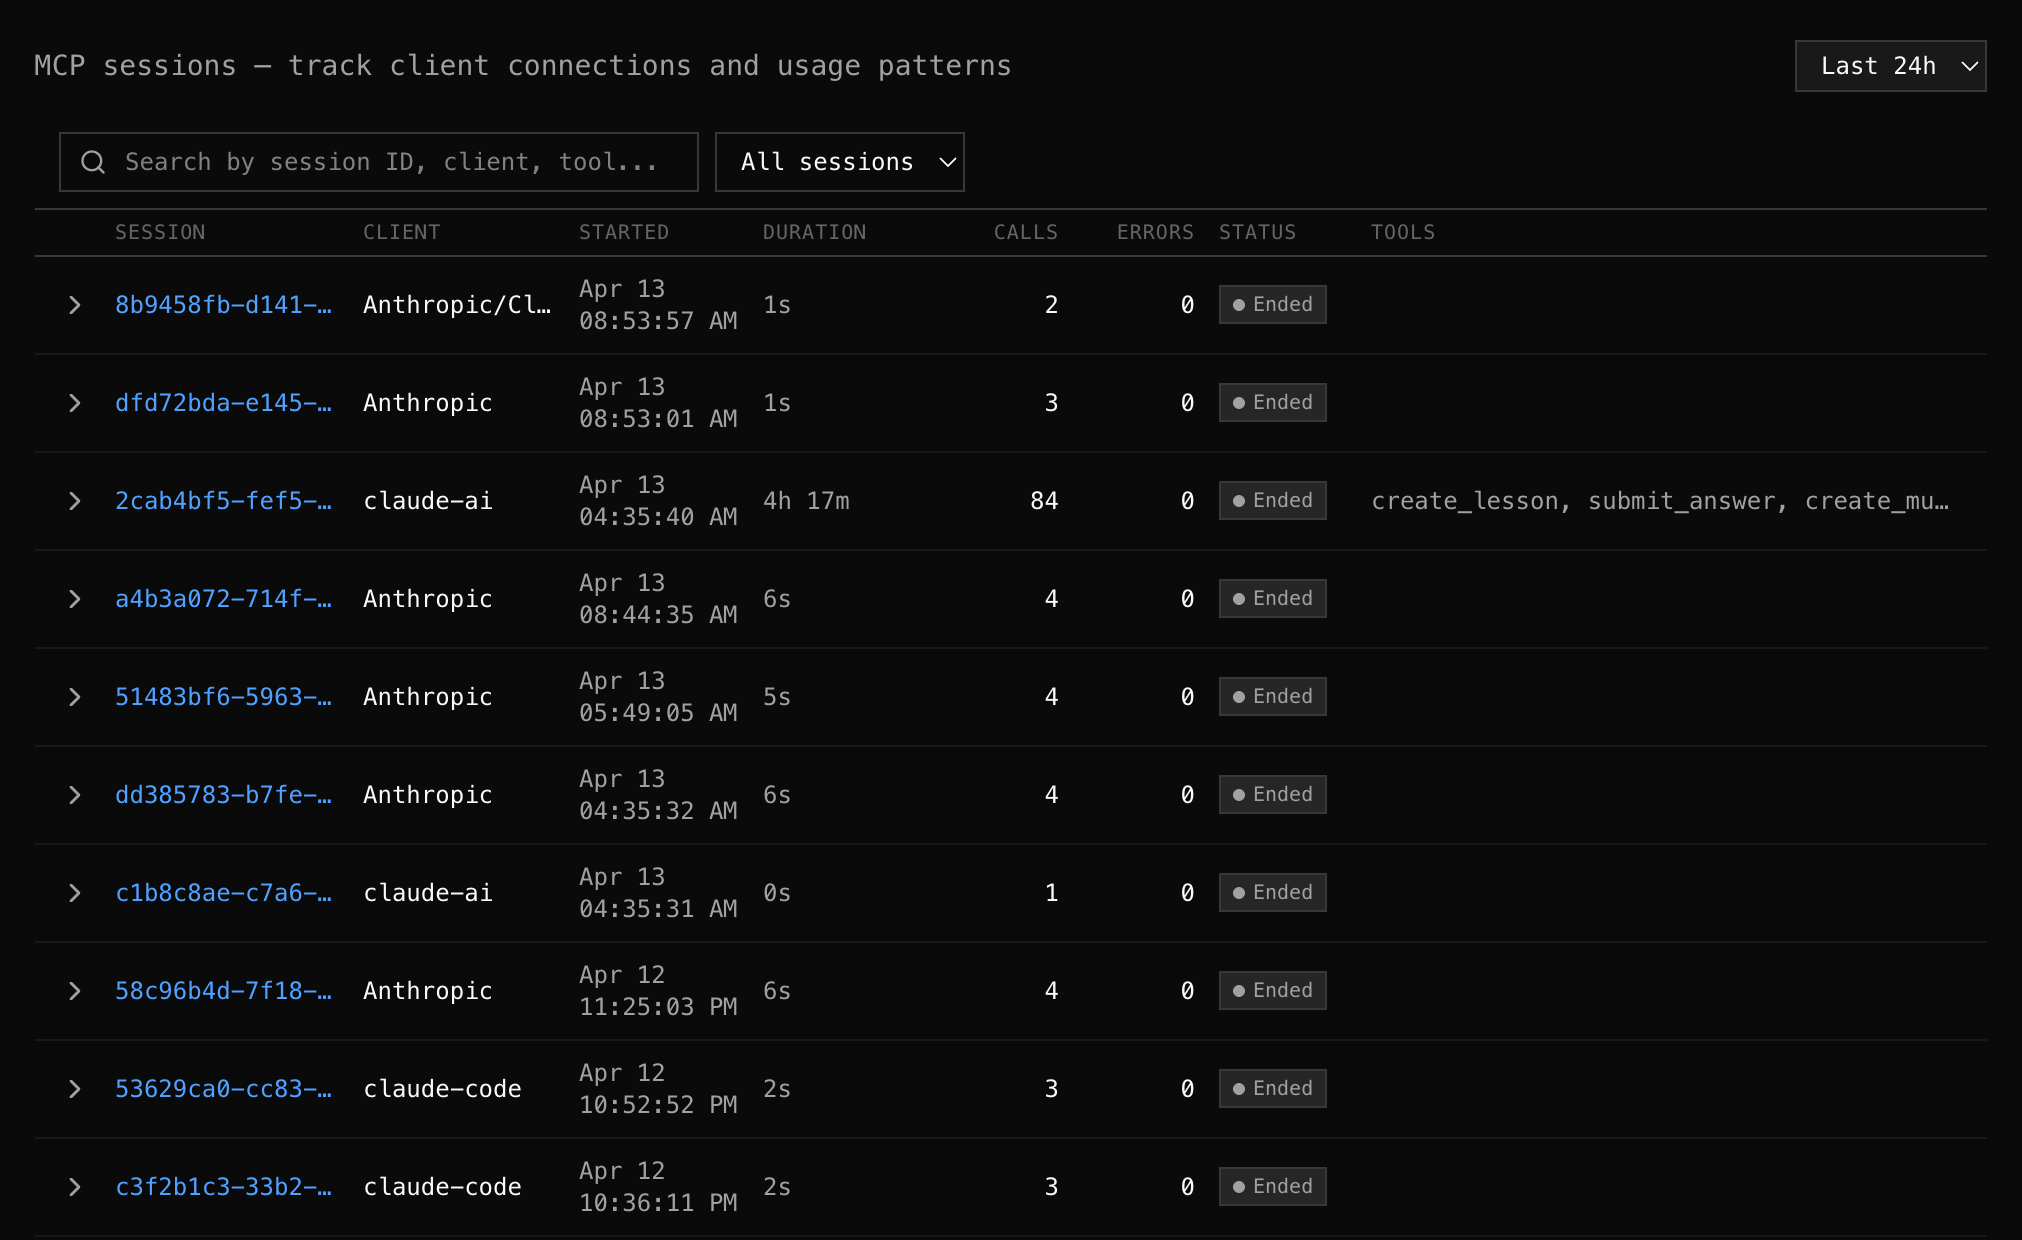
The Sessions tab shows every MCP session (one client connection lifecycle) with drill-down into individual events.
What is a session?
Section titled “What is a session?”An MCP session starts when an AI client sends an initialize request and ends when the connection closes. During a session, the client discovers tools, calls them, and eventually disconnects.
Each session row shows:
| Column | Description |
|---|---|
| Session | Session ID (from mcp-session-id header) |
| Client | AI client name + version (from clientInfo) |
| Started | When the session began (date + time) |
| Duration | How long the session lasted |
| Calls | Total MCP requests in this session |
| Errors | Failed requests (highlighted if > 0) |
| Status | Active (green) or Ended (gray) |
| Tools | Which tools were called |
Session Detail
Section titled “Session Detail”Click any session to expand it inline and see every event in chronological order:
session_start— connection establishedinitialize— MCP handshake with latencytools/list— tool discoverytools/call→get_weather— actual tool invocations with timing- Session end
Each event shows its timestamp, type, tool name (if applicable), latency, and status.
What to look for
Section titled “What to look for”- Retry patterns — “create_payment failed, then succeeded 2 seconds later”
- Slow discovery — is
tools/listtaking longer than expected? - Error context — which call failed, and what happened before and after?
- Session duration — long sessions might indicate stuck clients
Filters
Section titled “Filters”- Search — filter by session ID, client name, or tool name
- Status — show only active or ended sessions
- Time range — adjust the window
Use cases
Section titled “Use cases””A user reported the tool didn’t work”
Section titled “”A user reported the tool didn’t work””- Get the approximate time from the user
- Find their session in the list (filter by client if known)
- Expand the session to see exactly what happened
- Identify the failed call, error message, and surrounding context
”Are clients using the new tool?”
Section titled “”Are clients using the new tool?””- Look at the Tools column across recent sessions
- If the new tool doesn’t appear, clients haven’t discovered it yet
- Check if
tools/listresponses include the new tool (go to Tools tab)
“Why do some sessions have high error rates?”
Section titled ““Why do some sessions have high error rates?””- Sort or scan for sessions with errors > 0
- Expand to see which calls failed
- Check if errors correlate with a specific tool or time window